Moderators: cyao, michael_borland
-
Hwang, Ji-Gwang
- Posts: 40
- Joined: 21 Jan 2010, 02:27
Post
by Hwang, Ji-Gwang » 13 Jul 2010, 10:20
Dear every one and Borland
Sorry for bother you.
Thesedays I simulate the frequency map in PLS-II. But result of elegant is diifferent with AT.
So, I want to know the reason of the difference. I attached the file of the result of elegant and AT.
Which thing make the difference?

If someone know the reason, Please let me know
Sincerely yours.
Hwang, Ji-Gwang
-
Attachments
-
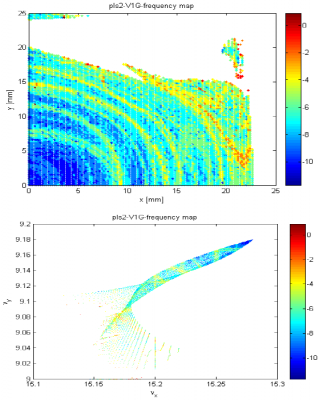
- Result of AT
-
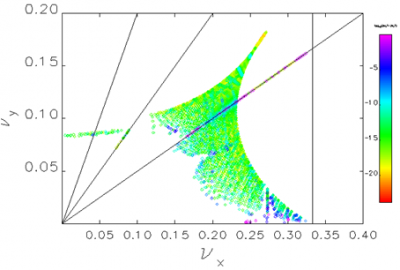
- Result of elegant
-
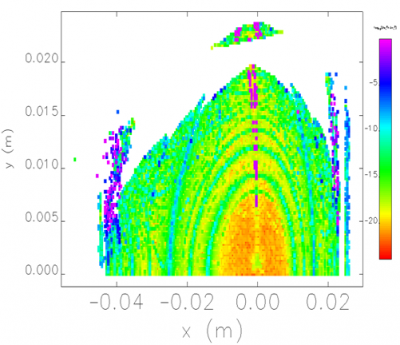
- Result of elegant
-
michael_borland
- Posts: 1933
- Joined: 19 May 2008, 09:33
- Location: Argonne National Laboratory
-
Contact:
Post
by michael_borland » 20 Jul 2010, 20:30
Ji-Gwang,
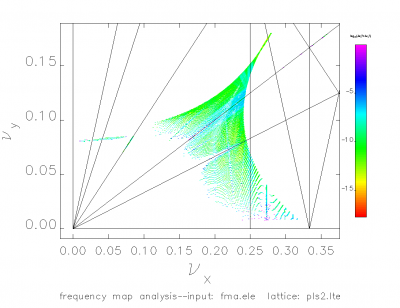
I used your lattice to compute the FMA and post it here. In general, it is hard to say why one program disagrees with another. It's helpful to study the different parameters of each element, such as number of kicks, integration order, and edge effects.
I used more kicks in the elements (24 instead of 10), plus finer spacing of the grid points and a one-sided x scan.
--Michael
-
Attachments
-
- fma.ele
- (325 Bytes) Downloaded 791 times
-
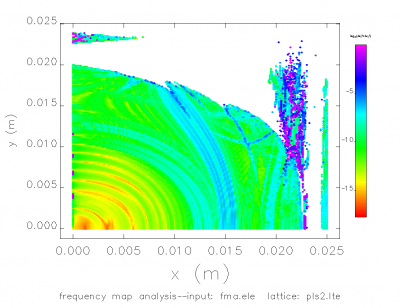
-
-
Hwang, Ji-Gwang
- Posts: 40
- Joined: 21 Jan 2010, 02:27
Post
by Hwang, Ji-Gwang » 21 Jul 2010, 01:20
Dear Borland
Thank you for kindness your reply.
These result has some purple color at the center of horizontal plane.
Maybe the purple color means the particle has very large tune shuft.
I think it is come from 3rd resonance line. Is it corrected? and Is it fine to operation?
I want to know your opinion about effect of purple lines at the center of x-plane.
I simulate the FMA examples with 1000 turns in elegant example directory . But it has also purple line at the center of horizontal plane. So, It look like bug.
I will check the effect of number of kick, integration order and edge.
Your plot graph is more detail. So it is good for compare the result. Could you give me your plot file for FMA?
Sorry for bother you.
Have a nice days.
Hwang, Ji-Gwang
-
michael_borland
- Posts: 1933
- Joined: 19 May 2008, 09:33
- Location: Argonne National Laboratory
-
Contact:
Post
by michael_borland » 16 Aug 2010, 09:32
Ji-Gwang,
Sorry I didn't see this sooner. The purple color does mean a very large tune-shift, but it is not physical. This happens when the x amplitude is small but the y amplitude is large. Nonlinear coupling between the planes gives motion that doesn't have a clearly defined frequency.
A few possible fixes:
* Use fewer turns. This will be make it more likely that the NAFF algorithm sees the same motion for the first and second half of the tracking data.
* Change the grid size. You may be able to avoid the problem region, which is often very thin, but changing the grid size. If the x range is symmetric, try an even number of grid points. If x_min is very close to zero, try to increase it somewhat.
My run input files are attached. I used Pelegant on an 8-core computer to make it faster.
--Michael
-
Attachments
-
- pls22.lte
- (2.1 KiB) Downloaded 744 times
-
- fma.ele
- (563 Bytes) Downloaded 741 times
-
Hwang, Ji-Gwang
- Posts: 40
- Joined: 21 Jan 2010, 02:27
Post
by Hwang, Ji-Gwang » 26 Aug 2010, 10:08
Dear Michael Borland
Thank you for giving tips. So, I test your tips. But the second one is not so good.
Because the frequency map depend on the x_min. This result is attached. The file name is "check".
I simulated the fma with 20 insertion devices. But This result is very strange.
The center of the fma has very large tune shift. I think It is not physical.
How is your opinion?
I have one question. I want to show the uncorrected orbit at the beam transport line.
But I don't know. Please let me know.
From Hwang, Ji-Gwang
-
Attachments
-
- 6mm with ID.pdf
- (198.55 KiB) Downloaded 930 times
-
- check.pdf
- (252.89 KiB) Downloaded 792 times
-
michael_borland
- Posts: 1933
- Joined: 19 May 2008, 09:33
- Location: Argonne National Laboratory
-
Contact:
Post
by michael_borland » 26 Aug 2010, 12:51
I can't replicate your problems with changing xmin and don't see how it could happen. When I change xmin, the frequency map changes in the expected way---i.e., it just begins at a different x value. I've attached a file you can try to see if it is a problem with your installation.
For the problem with IDs, how are you simulating them? If you can post the lattice file that would help.
For the transport line trajectory without correction you can look at the centroid output file (from &run_setup), just add errors, then track.
--Michael
[Edit 8/27/2010: Fixed first sentence. I said "I can replicate" when I meant to say "I can't replicate".]
-
Attachments
-
- testRun1.tar.gz
- Example of running FMA for two different values of xmin.
- (1.09 MiB) Downloaded 663 times
-
Hwang, Ji-Gwang
- Posts: 40
- Joined: 21 Jan 2010, 02:27
Post
by Hwang, Ji-Gwang » 27 Aug 2010, 22:59
Dear Michael Borland
I confirm your file. It has expected result. But your input file has two difference.
My input file has "maxamp" for 6mm undulator gap and don't define the ymin. I attached it.
I think the maxamp could be make difference. Now, I check it.
Have a nice day and weekend.
From Hwang Ji-Gwang
-
Attachments
-
- pls2.lte
- (1.35 KiB) Downloaded 721 times
-
- parTrack.ele
- (505 Bytes) Downloaded 749 times
-
michael_borland
- Posts: 1933
- Joined: 19 May 2008, 09:33
- Location: Argonne National Laboratory
-
Contact:
Post
by michael_borland » 04 Sep 2010, 16:51
Ji-Gwang,
I tried your files with x_min=1e-6 and x_min=10e-6. I didn't see any significant differences between the results, except for a narrow slice of points near x=0.
--Michael
-
Hwang, Ji-Gwang
- Posts: 40
- Joined: 21 Jan 2010, 02:27
Post
by Hwang, Ji-Gwang » 08 Sep 2010, 11:43
Dear Michael Borland
Hello. Thank you.
I check the result. The result is same.
Sorry. I confuse the result by the color code.
But I still has one more question. The file of "6mm with ID.pdf" has little strange result.
When I simulate the ring with 20 ID, 256 turns and 6mm insertion devies gap, the FMA has very large tune shift at
the horizontal (y=0) line and near the center. But I don't understand the results.
Because I think the center and horizontal line of ring is more stable.
That means the tune shift is more smller than larger amplitude particle.
Is it right? Sorry for bother you.
Best regards.
From Hwang, Ji-Gwang
-
michael_borland
- Posts: 1933
- Joined: 19 May 2008, 09:33
- Location: Argonne National Laboratory
-
Contact:
Post
by michael_borland » 09 Sep 2010, 22:15
Ji-Gwang,
I'm not sure of the reason for that, and I don't see it in my runs. Sometimes when one coordinate is very small and there is coupling, you can get spurious large diffusion or tune shifts. Perhaps that is the reason.
--Michael