
Current state and prospects of PV-WAVE based applications.
E.I. Litvinenko
Joint Institute for Nuclear Research,
Frank Laboratory of Neutron Physics
Abstract.
The development of the applications on base of such commercial packages for visual data analysis as IDL and PV-WAVE has become a fact in some of the neutron centers. The proposed report includes a brief summary of the existing PV-WAVE applications developed at FLNP of JINR, some information regarding the development which have been just started for HMI, and an overview of the aspects of the usage of PV-WAVE server by web clients.The list of existing applications in FLNP consist of the tools for experimental data access, manipulations and visualization with GUI based on PV-WAVE Point&Click package, 3D neutron PSD data viewer with GUI based on Wave Widgets, and the data processing server - a component of the distributed information system for IBR-2 status presentation on the web.
New offers of Visual Numerics regarding possibility to use PV-WAVE as a graphics and numerics server through the Internet will be considered and discussed.
Introduction.
This report is devoted to the overview of the experience in the implementation of the PV-WAVE visual data analysis software during last two years and to the analysis of the prospects of it for the nearest future.The goal of the purchasing of this VNI [1] software by FLNP at the end of 1995 was to decrease the development time and the efforts for the visualization applications and to provide an industry level GUI for the developed programs. The examples of the PV-WAVE usage can be found in the other neutron research institutes like HMI [2], LLB [3] and School of Chemistry in Bristol [4].
Applications for local usage.
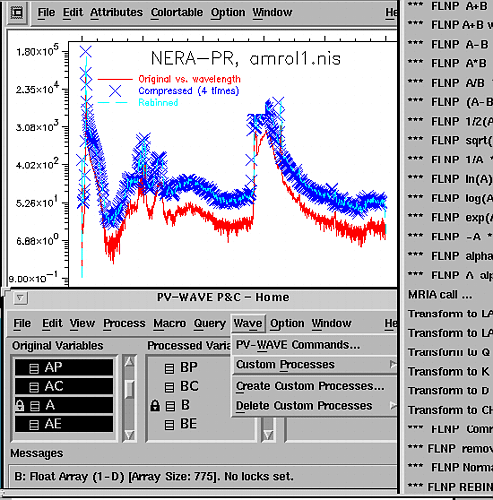
This class of applications can be executed on the workstation with installed PV-WAVE. The user can access the PV-WAVE from the workstation, X-terminal, or any computer with X-terminal emulator.The first application [5-8] was based on PV-WAVE Point&Click package. This ready-to-use GUI software permits one to add custom interfaces to its popup menus extremely easily. The developed tools provide FLNP users with possibilities to easily read their data acquired from any of the IBR-2 neutron instruments, view plot graphs with different types of X-coordinates, edit, save and manipulate them with automatic updating of the statistical errors (Figure 1).
The data are to be read to the special set of arrays, which had to be applied because of the fact that Point&Click does not support user-defined structures. This fact made the usage of the tools more complicated than it was desirable.
 |
 |
| Figure 1. Point&Click session example. |
 |
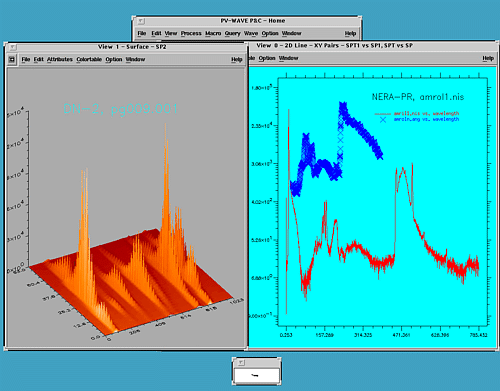
| Figure 2. DN-2 viewer session. |
So it became natural to investigate the latest VNI technology for GUI applications - so call VDA (Visual Data Analysis) Tools, which are natural progression from PVWAVE Widgets. They differ in that they are mini-applications in their own right, complete with a user-interface, graphical elements, a message dispatch and processing mechanism, inter-tool communication and a tool manager.
The advertised and important features of the VDA approach are:
- Building-block approach to application development;
- Reusable tool components;
- Easy customisation;
- Cross-platform development and deployment;
- National language support;
- Extensions to PV-WAVE kernel;
After three weeks of staying at Berlin the following results have been reached:
- The first version of new program OpenG2 was installed for testing.
- This of course uncompleted version permits users at HMI to choose their data with standard GUI file browse window, to choose a type of data and plot labels, to read and immediately get a plot graph of the data.
- The data are to be read into workspaces (similar to the workspaces in OpenGenie [9] and LAMP [10]), which are an associative arrays and permit one to add any additional components to them.
- The created workspaces are to be appeared as a main program level variables and can be examined and used by any PV-WAVE command.
- Special VDA Tool WzWPlot have been developed for the plotting data contained in workspaces, which has some additional possibilities in comparison with its parent (template) WzPlot VDA Tool by VNI (Figure 3)
- The user can add more workspaces into WzWPlot window very easily, select any part of the data by mouse, zoom in and out and so on.
- The publication quality printing (Figure 4) )can be done both from any WzWPlot window and from WzMultiView window (Figure 5) which can be used to combine many plots (in different sizes) into one picture.
- The user session can be saved and restored later with all workspaces and pictures.
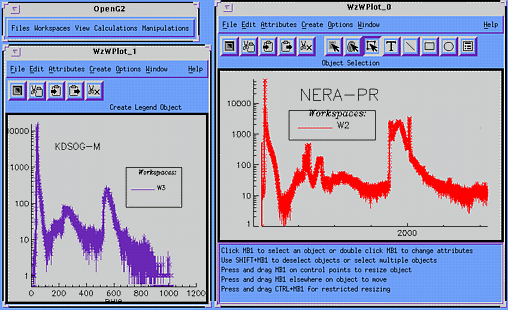 |
| Figure 3. WzWPlot examples. |
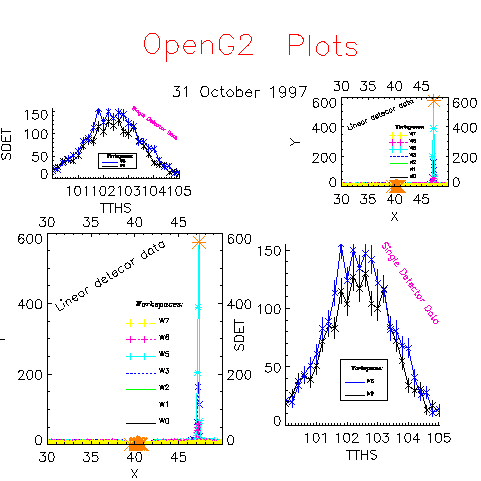 |
| Figure 4. Printing example. |
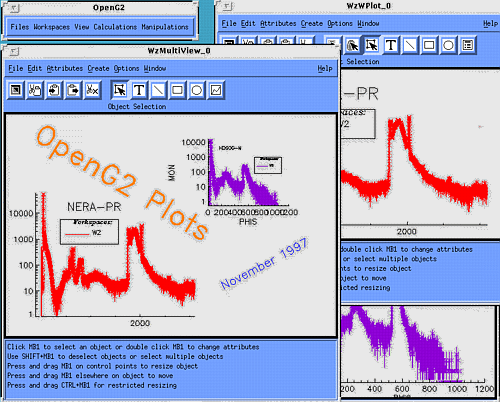 |
| Figure 5. WzMultiView usage example. |
It was not enough time to add possibility to fit selected portion of the data, to use smoothing, Minuit program and some others possibilities available in G2, but it was decided to continue this cooperative development in the nearest future. This program have been adapted for FLNP after coming from Berlin and IBR-2 data can be read now into workspaces and plotted in WzWPlot windows as well as HMI data.
From the point of view of the summary of this first VDA technology application experience, the essential feature of this approach is the possibility to use an original code for some VDA Tool provided by VNI as a template for a new one. This permits one to change many parts of the code to make a customusation, but in case of possible future changes of the base template in next versions of PV-WAVE the code of the "child" tool will have to be rewritten. So the absence of the true object-oriented approach, natural for GUI objects programming, will lead to the difficulties for the VDA technology implementation. Another important advantage of VDA approach is possibility to execute any PV-WAVE command, including call of the new instance of any VDA Tool, during application is running, and this is extremely important for interactive data analysis.
The usage of PV-WAVE server by web clients.
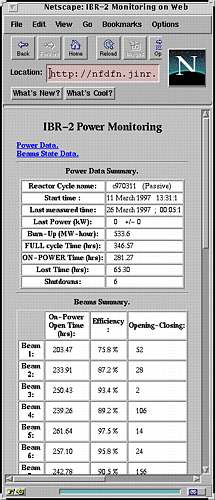
The second class of the applications devoted to the usage over Internet. VNI advertised the examples and some ways to do it in summer 1996 [11,12].At FLNP we implemented this technology to present the IBR-2 mean power and beams state current status on the web [13,14]. The distributed system, presented on DANEF'97 workshop, consists of several components executed on different machines: the measurement program, the data state notification program, the CGI program and the data processing server which analyzes the request and starts data processing process.
 |
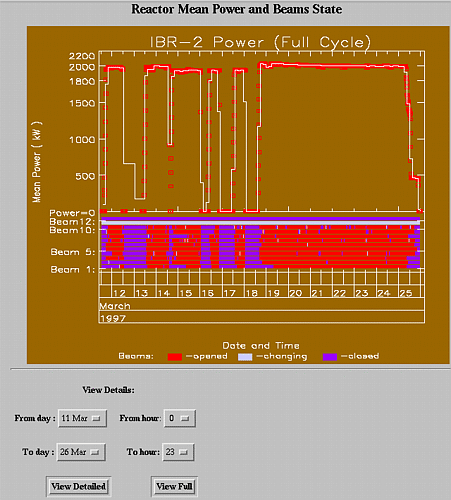 |
| Figure 6. Reactor status on the web. |
The key feature of PV-WAVE to be implemented in pair of CGI program is the possibility to generate HTML and especially GIF files with plot results. For this system the standard plot possibilities have been complemented by the specially developed procedures to add horizontal color bars for visualization of the beams state along the plot. The GIF file initially generated by the PV-WAVE command is additionally compressed after that to provide its size as small as possible (4-8 Kb).
Processed information about current reactor cycle and about last requested cycle is kept between requests, and next time data files are read only in case the different cycle is requested. In any case of user request the data extraction and processing of the extracted data to generate detailed view on some cycle is executed.
The system has been used in evaluation mode since November 1996 and last update of the data processing module was made in March 1997. This module provides stable work all the time when measurement system provides data files for processing as well as in time of reactor is idle.
The way of interaction of the distributed system components is very simple and looks maybe too traditional - simple user interface (HTML forms), plain CGI interface, the processing results are generated as files (HTML and GIF). One of the tips was to provide way to avoid cashing the pictures by web browser, when view current reactor status. Another tip was to do processing of every user request and every new portion of reactor data as fast as possible.
This system can be designed without implementation of more advanced user interfaces (like Java) on client (web browser) side. But if to think about the projects to use such an expensive software like PV-WAVE as a data analysis server for web clients with special GUI, this experience can be important.
Recently VNI released the library for development JAVA interfaces to PV-WAVE server JWAVE [15]. JWAVE is a set of Netscape IFC [16] components for building visual and numerical applications written in Java. Components are the building blocks of an application's interface. Java program with JWAVE components can be run either locally or over the Internet/Intranet. We have not yet possibility to apply it (the only JWAVE version for Sun platform is for Solaris, and we still have not Solaris) but some notes can be made after the documentation study.
On the server side VNI provides now PV-WAVE process manager, which starts processes (up to configured number of processes) and acts as broker for requests from each applet. The communication with this process manager (WaveManager daemon) can be done using a direct socket connection (mainly for stand-alone applications ) or through CGI script (recommended) JWaveCGI (written in JAVA) installed in cgi-bin directory of the web server. JWAVE classes should be also available from this web server. JWAVE graphics components and numerics applications must have a corresponding PV-WAVE server procedure (interface function) to run on the server-side. The prewritten interface functions exist for plot components provided by Visual Numerics.
On the client side: Netscape IFC must be installed on the client machines to provide better performance (in some cases it is enough to have Java-enabled browser).
In principle it is possible to pass any number of variables back and forth between PV-WAVE and the Java program. In case of executing stand-alone Java application with direct socket connection method there is no problem to read data files from remote user mashine and send them to PV-WAVE server for processing. But in case of CGI connection method Java applet possibilities are not sufficient to post data file to the server, and again HTML forms should be implemented for user interface. The example for IDL [17] server has been demonstrated by D.Kearley and D.Richard on VISONS'97 workshop [18].
So, the main method to provide remote users with a possibility to have access to PV-WAVE server dedicated to special data processing is to provide JWAVE applications, which can be downloaded and installed on the remote user machine. In this case the user can use both local JVM (Java Virtual Machine, can be java by Sun) and Netscape to load special HTML interfaces to Java application. The performance of this method will be better than one with CGI connection (while Java application will connect directly to WaveManager daemon), and the application will be able to load user data files to send to server for processing. The main disadvantage of this method is difficulties in case of firewall.
The second point about JWAVE is the fact that JWAVE graphics components at the moment are just interface to the base plot commands, not to any of VDA tools. So, all elements of GUI similar to VDA GUIs should be provided by JWAVE application programmer. That means that the functionality of JWAVE applications is much more restricted than the possibilities of local PV-WAVE applications.
Conclusion.
The development of local PV-WAVE applications based on VDA tools technology can be performed quite fast. It is possible to get many advances in providing maximal easy-to-use functionality. The possibility to implement the workspaces is very perspective as well.At the moment the most helpful implementation of remote access to PV-WAVE server looks like stand-alone Java applications configured for direct socket connection method. The better performance and possibility to have access to the remote PV-WAVE programs without additional licenses will compensate the inconveniences with necessity to install JWAVE program on the user machine.
Acknowledgments.
I am very appreciated to Y.A.Astakhov for the help, to many of my colleaques for the interest, and Dr.P.Mertens and G.Lampert from HMI for the nice possibility to work with them.References.
- VNI: http://www.vni.com
-
The Experiment Control Programs for Neutron Spectrometers at BENSC,
K.-H. Degenhardt, E.Busse, U.Vidic, S.Robberg, S.Dutzmann,s.Miemitz, P.Mertens
Proceedings of the Intern. Workshop DANEF 97, Dubna 1997,305-312 - NEWSAS: http://193.49.43.2/computing/nobugs/contributions/Buteau4Mar15_45_02.html
- R. Richardson: http://193.49.43.2/computing/nobugs/abstracts/Richardson.htm
- PV-WAVE in FLNP: http://nfdfn.jinr.ru/flnph/pv/pv_info.html
-
Interactive Data Analysis for Neutron Spectrometers Data Based on Visual Numerics PV-WAVE Software Package
, E.I.Litvinenko,
Nuclear Instruments and Methods in Physics Research, A 389 (1997) 93-94 -
PV-WAVE Based Tools for Visual Analysis of Neutron Scattering Data in FLNP
, E.I.Litvinenko,
Proceedings of the Intern. Workshop DANEF 97, Dubna 1997, 248-258 - VISONS'97: http://ndafleetwood.nd.rl.ac.uk/conferences/visons97.htm
- Open GENIE: http://www.isis.rl.ac.uk/GENIEManual
- LAMP: http://www.ill.fr/data_treat/lamp/front.html
- PV-WAVE Net Possibilities: http://www.vni.com/garage/vg_wht.html
- PV-WAVE and Java: http://wave.esm.vt.edu/wapplet/wapplet.html
-
Distributed Information System for Neutron Reactor Status Presentation on the Web
, Yu.A.Astakhov, E.I.Litvinenko, Yu.N.Pepelyshev, A.I.Tulaev ,
Proceedings of the Intern. Workshop DANEF 97, Dubna 1997, 259-264 - http://nfdfn.jinr.ru/flnph/ibr-2/cycles/ibr2_monitoring.html
- JWAVE: http://www.vni.com/products/wpd/jwave/
- Netscape IFC: http://developer.netscape.com/library/ifc/
- BARNS: http://barns.ill.fr